

Volume Profile
How much volume has traded at each price, with POC, value area and high and low volume nodes. Thirteen different frames: session, week, month, swing, selected range and more.
See in detailEach one answers something specific about what is happening on the chart. Here is what each does and which pack it comes in.
How much volume has traded at each price, with POC, value area and high and low volume nodes. Thirteen different frames: session, week, month, swing, selected range and more.
See in detail
The profile that recalculates over whatever you are looking at, so you can read the volume distribution of the stretch you care about without setting dates.
See in detail
Classic Market Profile: measures time per price rather than volume. Initial balance, extensions, day type and an overlaid volume or delta profile.
See in detail
Heat map of traded volume across the price and time grid, with bands that persist through the session and the previous day's high volume levels.
See in detail
Volume accumulation zones turned into support and resistance, with thickness.
See in detail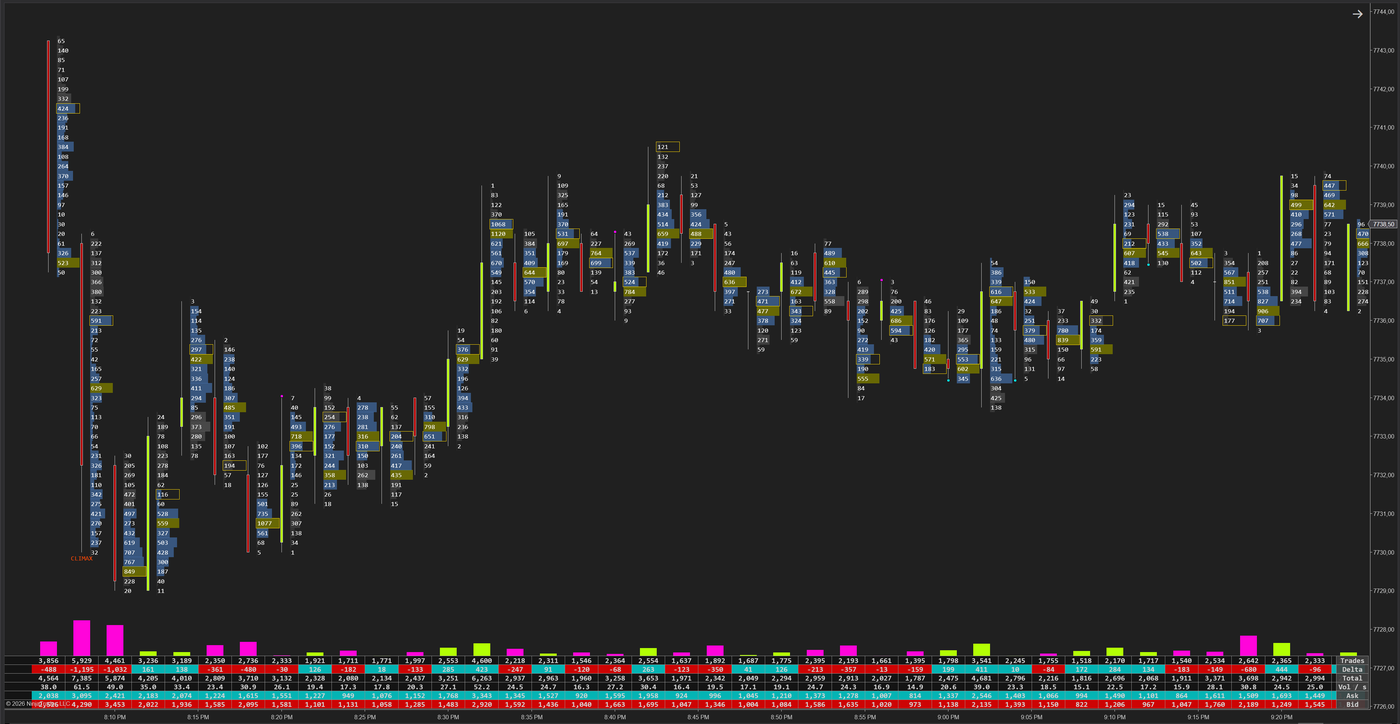
The inside of every candle: contracts traded at bid and at ask for each price, imbalances, trapped traders, per-bar POC and a stats table. Runs without Tick Replay.
See in detail
The tape with every filter: minimum size, grouping and highlighting for the prints that matter.
See in detail
Marks large trades at the exact price they executed, telling apart aggressive buying from selling.
See in detail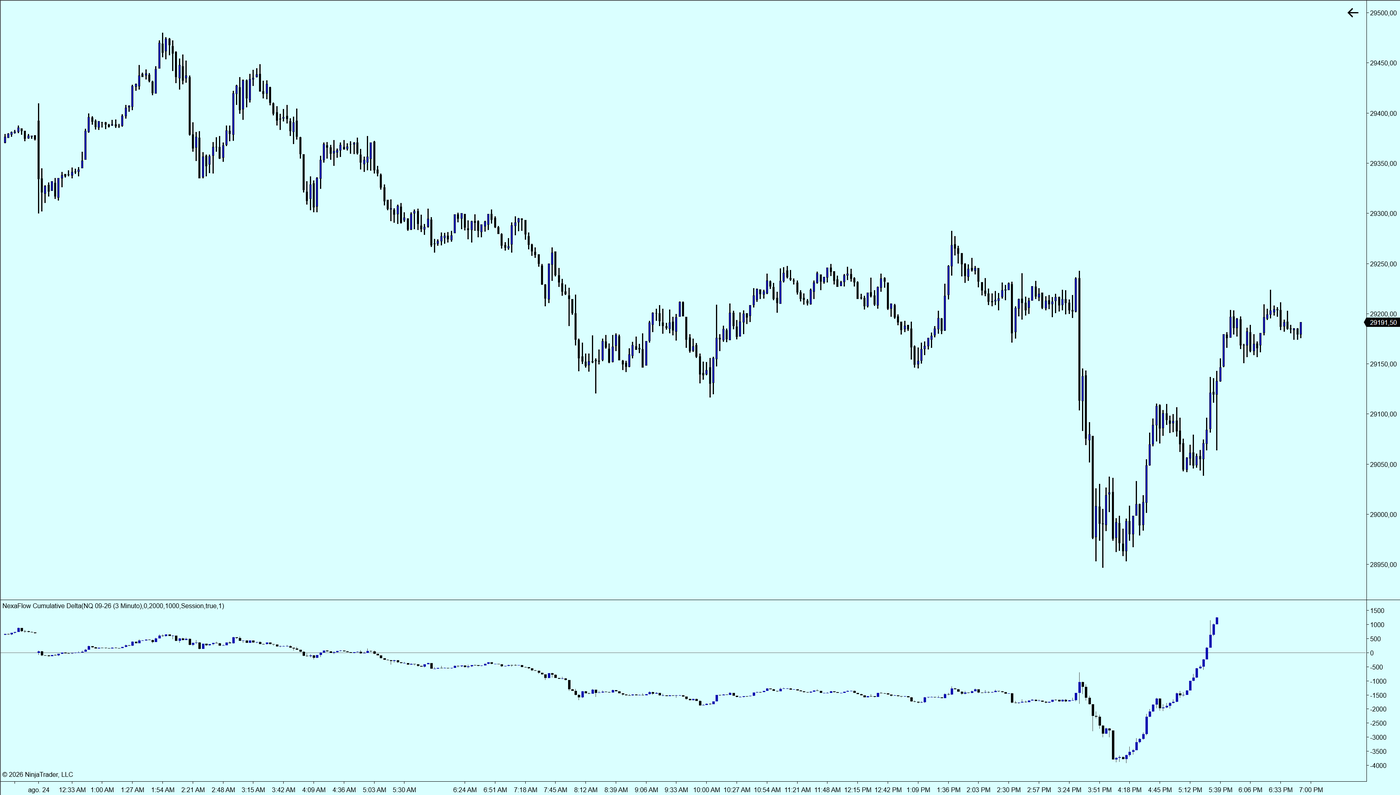
Running difference between aggressive buying and selling, as candles, histogram or line.
See in detail
Delta distributed by price across the session, to see where pressure built up.
See in detail

The aggression split of the moment, with the sample threshold set against the instrument's usual volume rather than a fixed figure.
See in detail
Structural highs and lows, breaks and changes of character marked on the chart.
See in detail
The levels that govern the session: open, previous highs and lows, and their reactions.
See in detail
The opening range with its band, its extensions and the levels that tend to order the day.
See in detail
Seven time bands with the live session highlighted and highs and lows extended until they are swept.
See in detail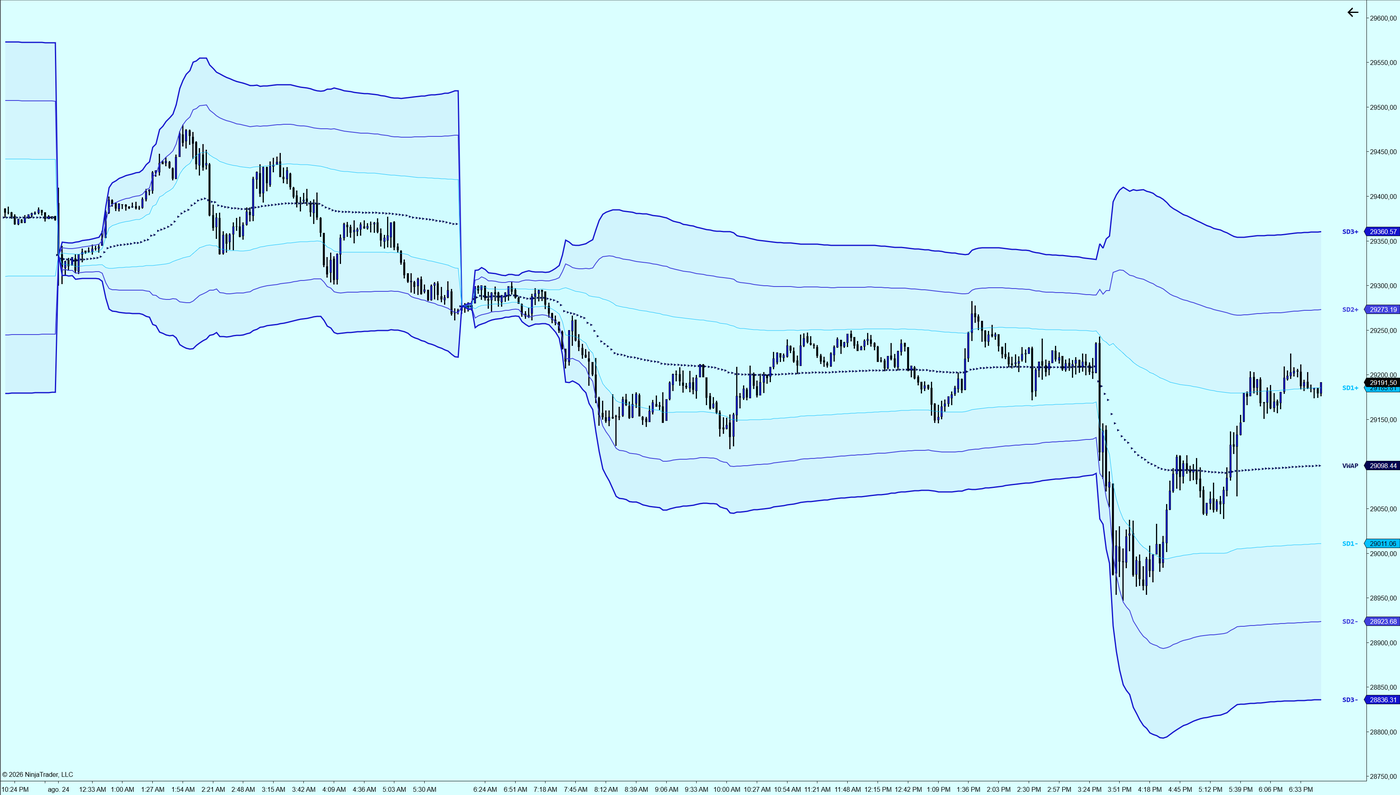
Volume weighted average price anchored wherever you choose, with deviation bands.
See in detail
Filled band between two moving averages, coloured by direction, with a turn marker.
See in detail
Fibonacci retracements inside a trend structure that adapts on its own, with a status chip and calculation on the timeframe you choose.
See in detail
Candles from up to four higher timeframes drawn on the right, at real price and with a close countdown.
See in detail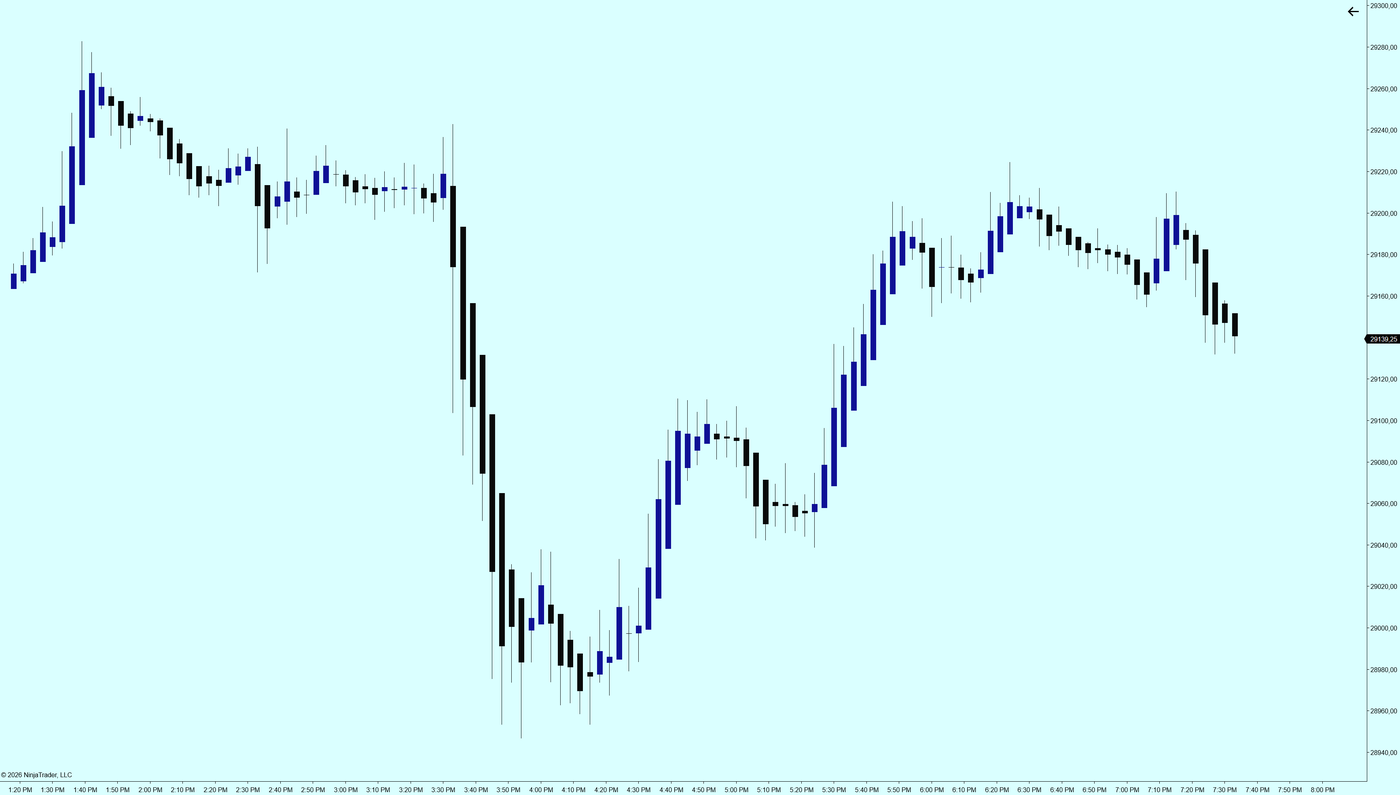
Heiken Ashi candles over the chart, with optional smoothing and colour change markers.
See in detail
Volume histogram with thresholds relative to average and range, separating absorption from intent.
See in detail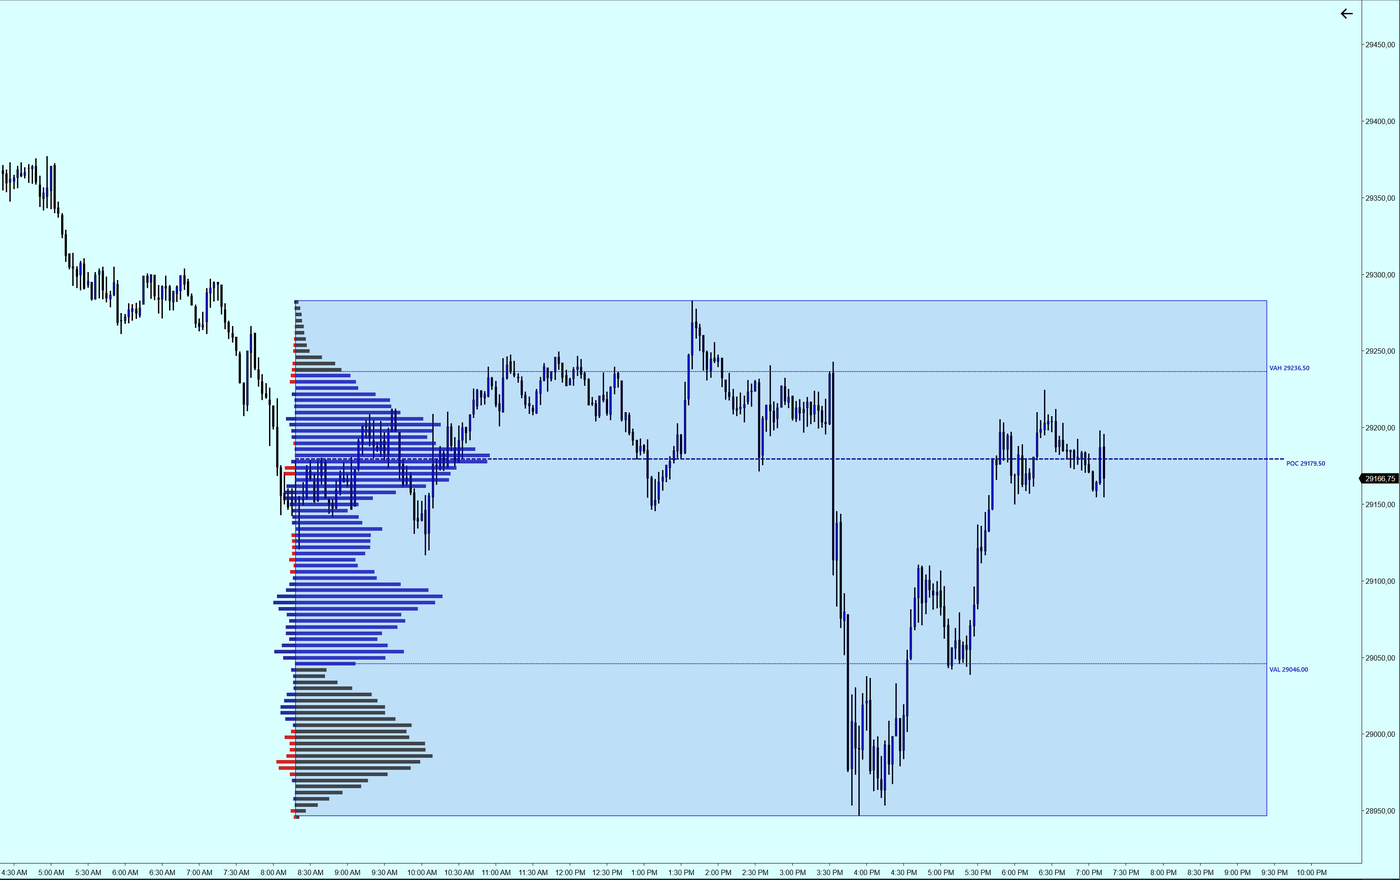
A drawing tool rather than an indicator: select a stretch of chart and it gives you its volume profile.
See in detail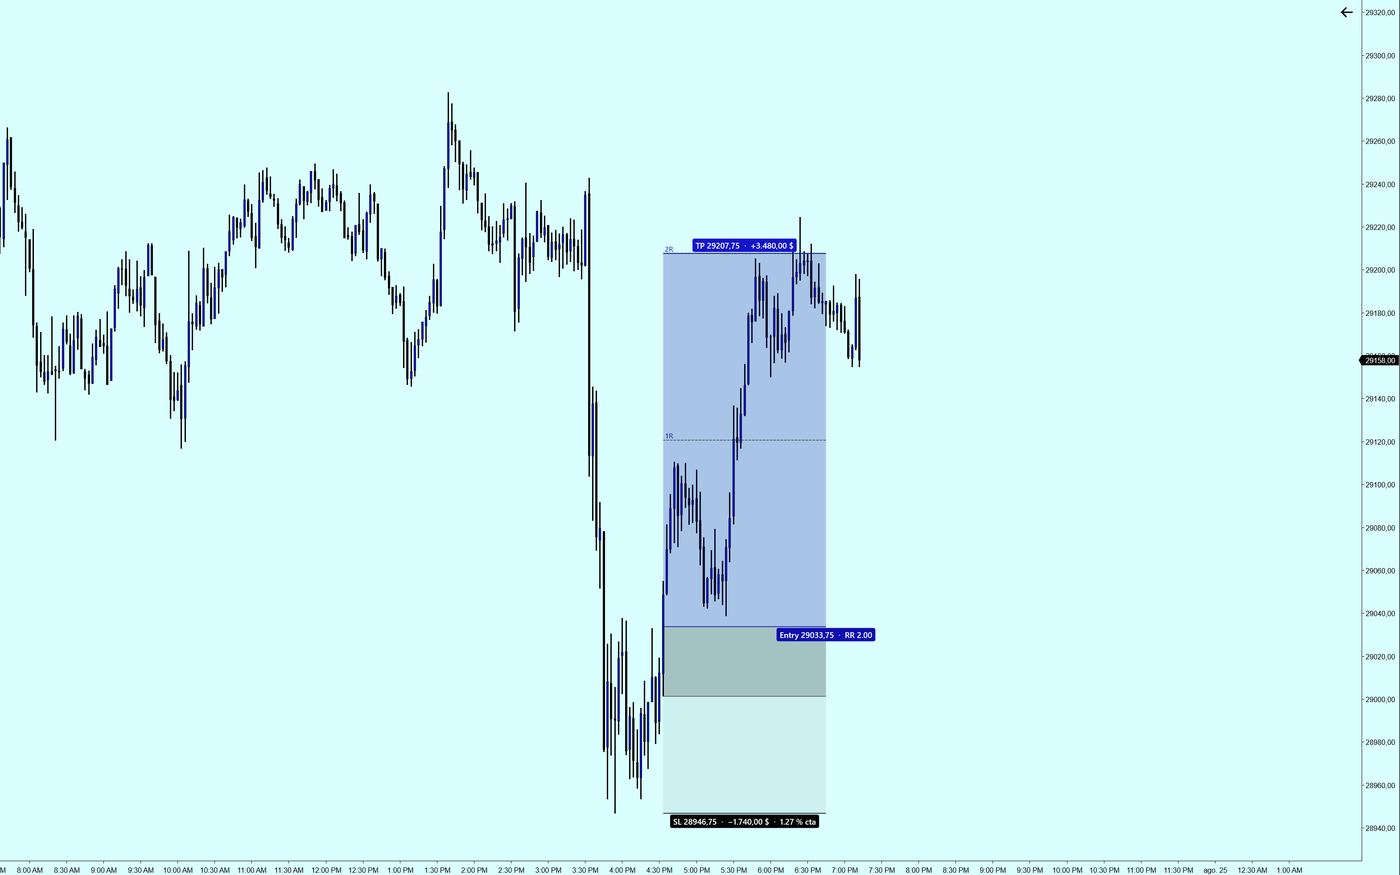
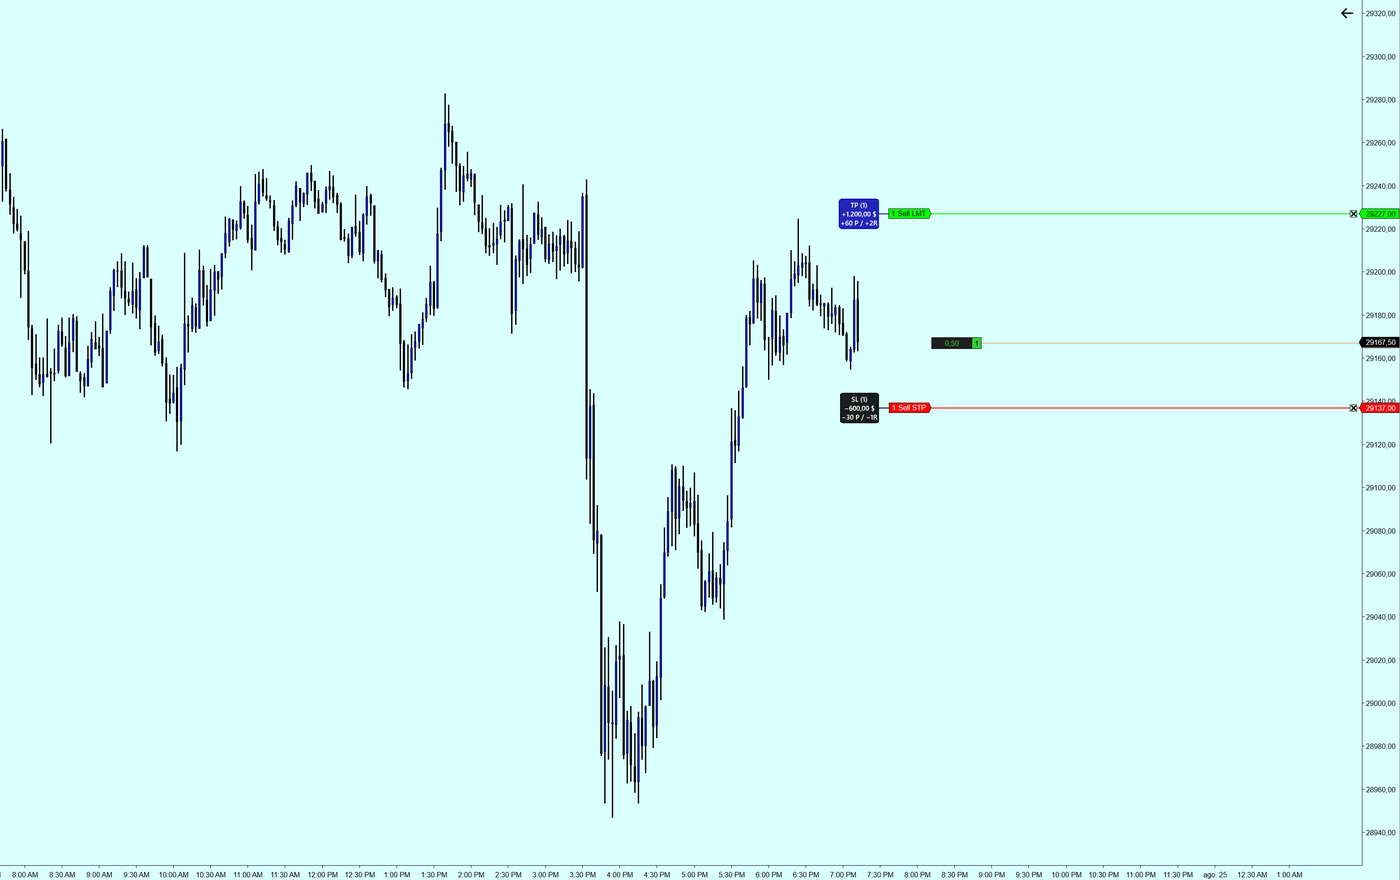
The Complete pack includes the 22 indicators on this page, plus Range Profile. Position Tool and Order Boxes make up the Tools pack, included with any purchase.