
Your trading journal, with nothing to import.
Journal reads your trades straight from the platform's own database. No broker connection to authorise, no sync to babysit, no CSV to upload: you open the window and your history is already there.


No imports, no permissions
Journals that live on a website need you to authorise access to your broker and need the sync to keep working. Journal lives inside the platform and reads the data where it already is, so it works with any broker you have connected.
Matches the way your broker does
Executions are matched first in, first out — the same rule brokers use — so the figures line up with your account statement.
One position is one trade
Opening across twenty executions and closing in one go is not twenty trades. Journal groups from the moment the account leaves flat until it is flat again, so trade count, hit rate, streaks and duration stop being inflated.
Performance dashboard
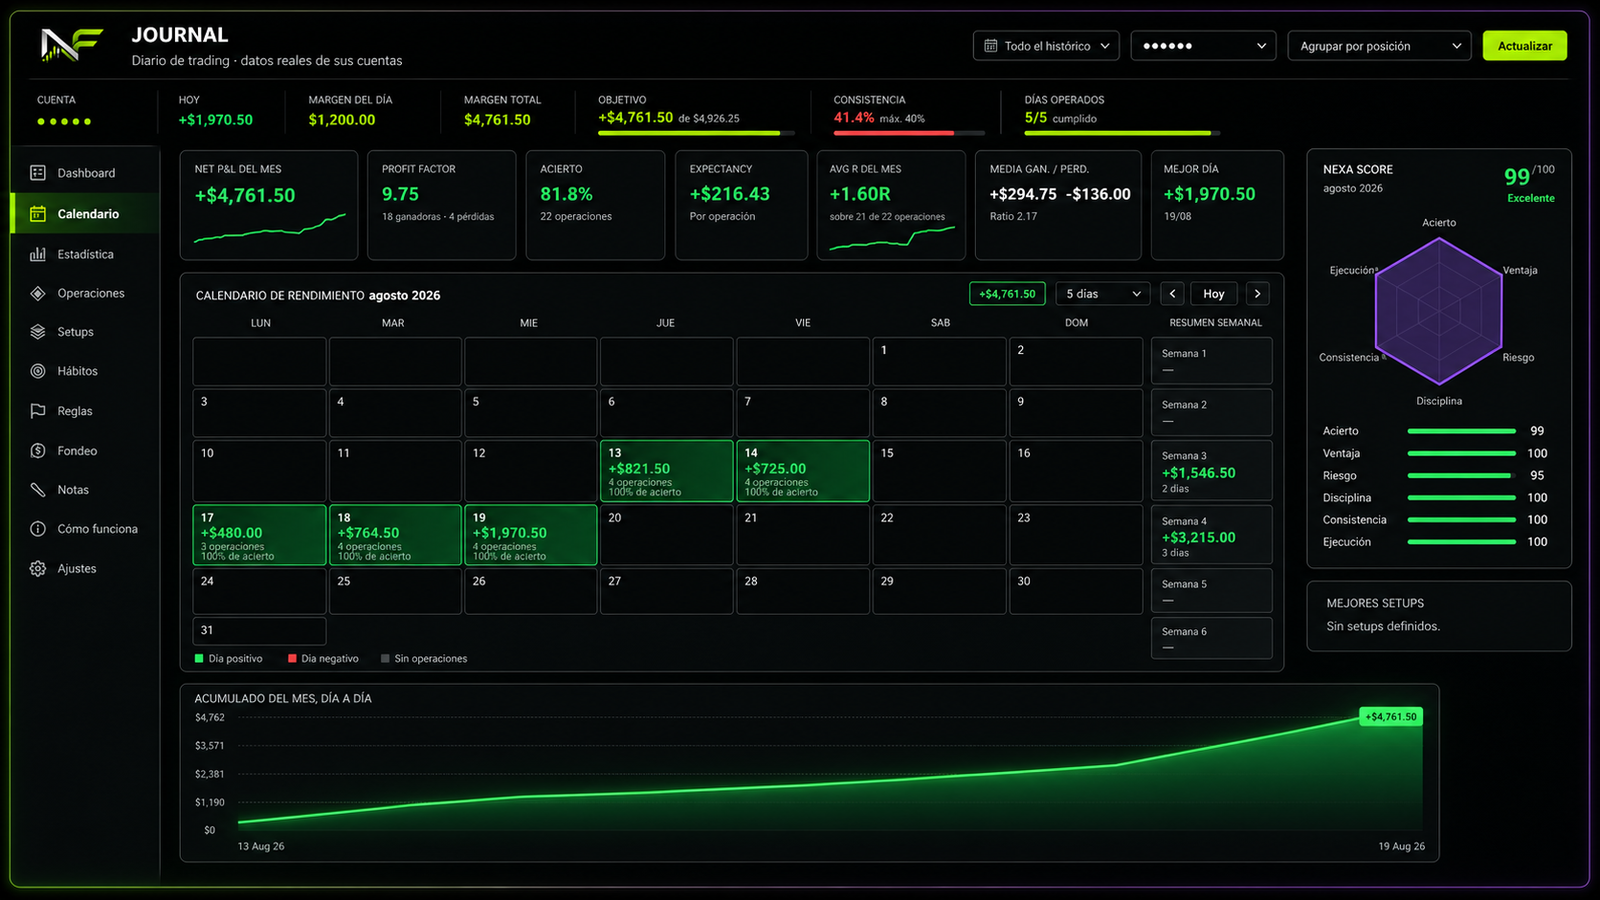
Net result, hit rate, equity curve and comparisons, drawn inside the window itself.
Monthly calendar
The month at a glance, day by day, to see where the good and the bad cluster.
Per-trade detail
Entry, exit, duration, size, how far it ran in your favour and against you, and your notes.
Setups with checklists
Define your own setups with their checklist and tags, then look at which ones behave best.
Funded account rules
Tracks the target, the daily loss and consistency using the arithmetic prop firms actually use, rather than a generic spreadsheet.
R multiples come from your own orders
Journal works out the risk of each trade from the stop you actually sent, pairing it with the entry through the relationship the platform keeps between orders. You do not have to type the stop by hand on every trade for the R figures to mean something.
What to know first
Journal shows your own data: it is not an analysis service and it does not provide recommendations. The maximum excursion for and against each trade is rebuilt from price history, so it depends on the data you have loaded in the platform.