
Before you enter · NinjaTrader 8
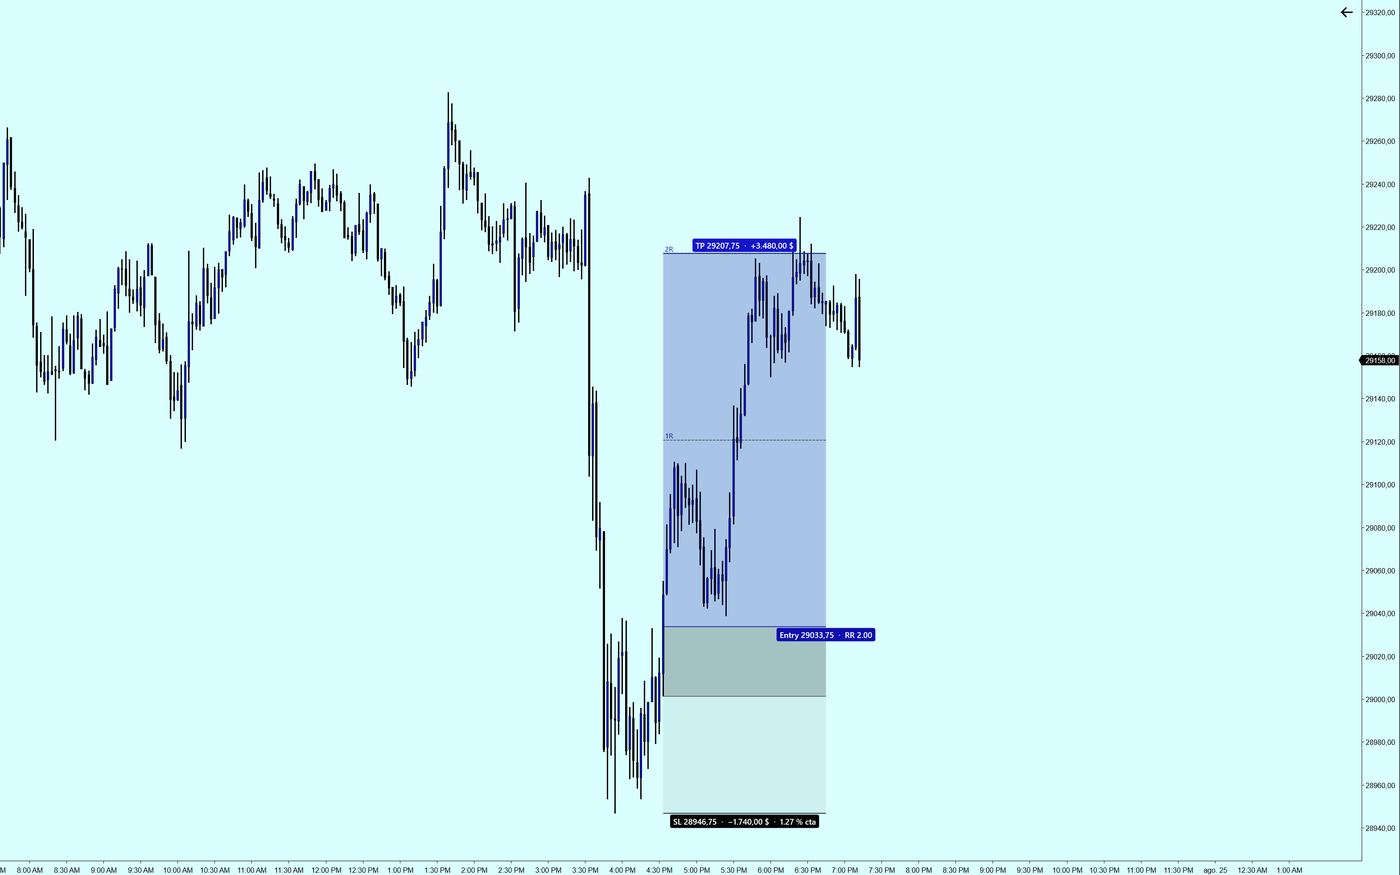
Screenshot of the tool running.
Draw the trade before you have it.
Three clicks —entry, stop and target— and the chart shows the zone you are risking, the one you hope to make, and the ratio between them. No orders involved: this is for deciding whether the trade is worth taking.
Risk and reward to scale
Both zones are drawn at true size over price. A target that looked reasonable stops looking that way next to its stop.
The ratio, live
It recalculates as you drag. And if you fix a multiple, the target repositions itself when you move the entry or the stop.
1R, 2R, 3R levels
Marked inside the reward zone, so you can see where partial exits would land.
What each term means
The names the indicator uses, and what each one means.
- R. The unit of risk: the distance from entry to stop.
- Ratio. Expected reward divided by risk.
- Chips. The entry, stop and target labels with their price.