
The noise in the candle, filtered out.
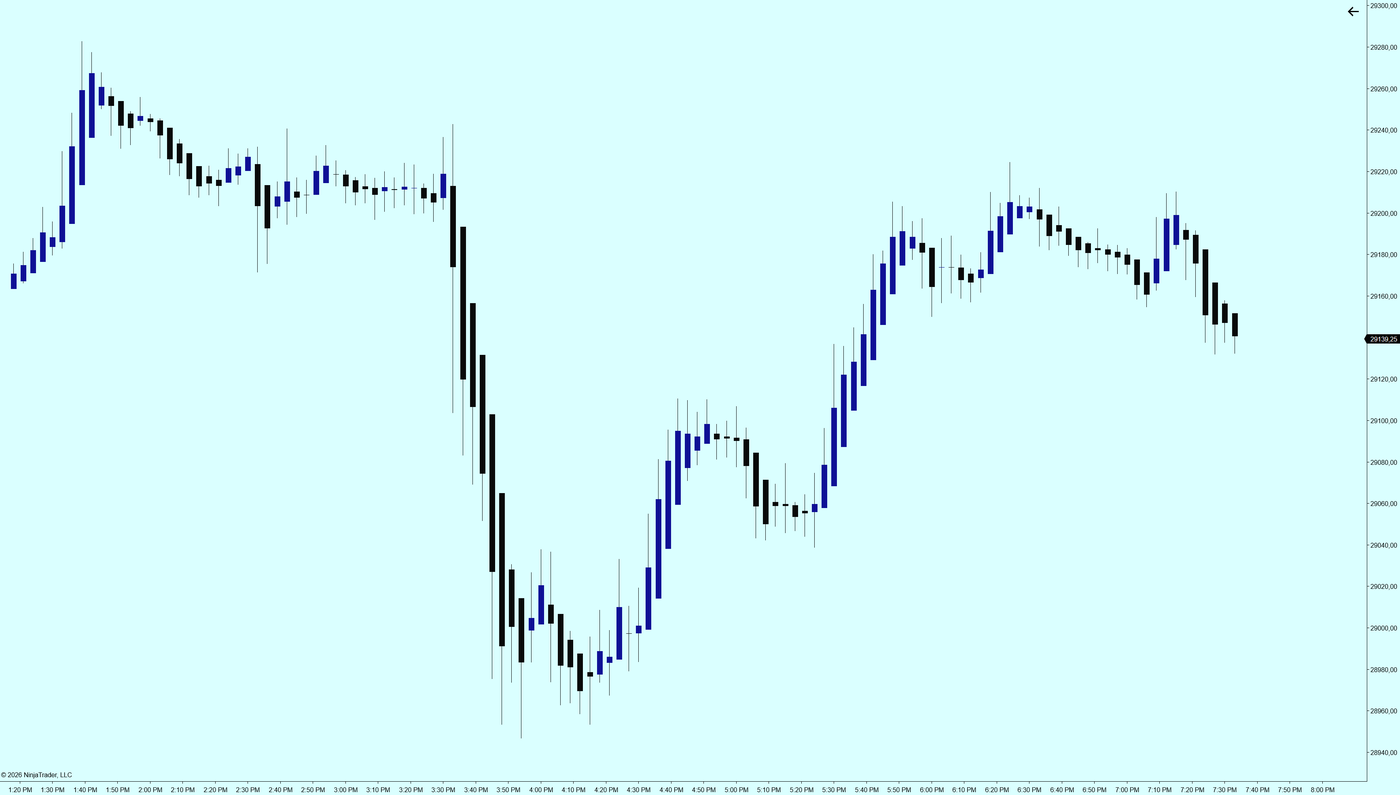
A Heiken Ashi candle averages with the one before it, so a run looks like a run instead of fifteen candles flipping colour. This one draws its own over the chart and hides the real ones, without you changing the bar type.
Classic or smoothed
An optional exponential average before the calculation, another after, or neither. Over-smoothing turns any chart into a perfect trend that arrives late.
No bar type to change
The real candles hide themselves while the indicator is on the chart. Remove it and they come back, so the rest of your tools keep working on the actual bars.
Dojis and turns marked
A doji —a tiny body inside a wide range— is where the run hesitates. It gets its own colour, and the candle's change of colour carries a marker.
What each term means
The names the indicator uses, and what each one means.
- Heiken Ashi. Japanese for 'average bar': each candle averages with the previous one.
- Pre-smoothing. An exponential average applied to prices BEFORE building the candle.
- Post-smoothing. The average is applied AFTER, on the finished candle.
- Doji. A very small body against the range: neither side is in charge.
- Turn marker. The bar where the candle changes colour.
Where it lives
Included in Starter, Essential and Complete. Starter is the free pack, so this indicator can be tried at no cost.